


Gold and Silver See Sharp Pullback in Late January 2026; Some Fear It Signals Looming Liquidity Crisis
A sharp correction in gold and silver prices in late January 2026 has sparked investor concerns about a potential US liquidity crisis. Historically,
After a rapid rally in January 2026, gold and silver prices experienced a significant correction in the final two trading days of the month. This has led some investors to worry that the pullback in precious metals may be signaling an impending liquidity crisis in the United States.
Traditionally, precious metals like gold and silver are considered safe-haven assets. Their prices often rise following negative external shocks such as geopolitical conflicts or pandemics. An old Chinese saying, "hoard gold in times of turmoil," reflects this long-held belief.
In the modern monetary and banking system, fiat currency issued by central banks is multiplied through the commercial banking system via deposit creation, ultimately determining the total amount of money circulating in society and its velocity. Therefore, during a liquidity crisis, when forced selling floods capital markets, the prices of precious metals like gold can also experience severe volatility.
Take the 2008 US subprime mortgage crisis as an example. The price of gold dropped by roughly one-third immediately after the crisis erupted. It wasn't until the U.S. government intervened with loose monetary policy (quantitative easing) that gold prices recovered and eventually surpassed their pre-crisis highs (as shown in Figure 1).
Figure 1: Weekly COMEX Gold Price Chart (January 2007 – December 2010)
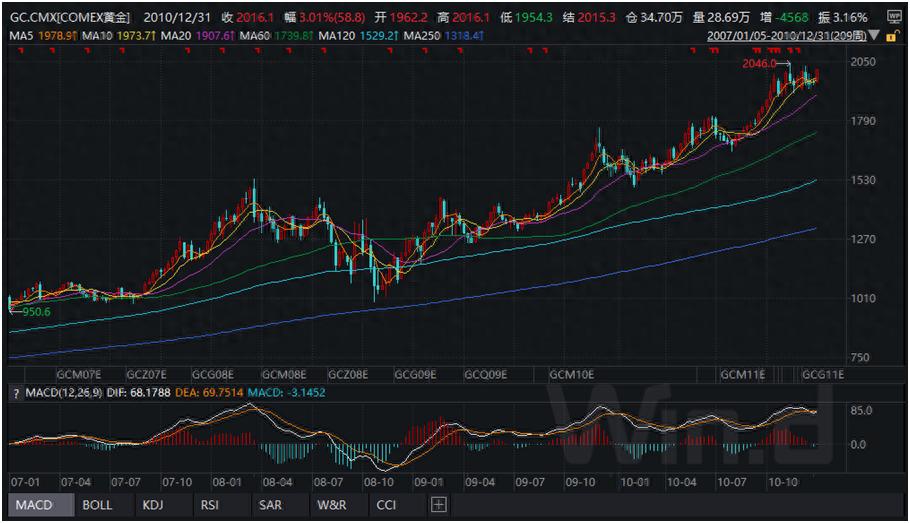
Data Source: Wind
The 2008 crisis illustrates the close link between gold prices and financial turmoil. In March 2008, investment bank Bear Stearns faced a run due to its massive holdings of subprime derivatives. The Federal Reserve invoked Section 13(3) of the Federal Reserve Act for the first time since the Great Depression, facilitating a $29 billion secured loan through JPMorgan Chase and its subsequent fire-sale acquisition of Bear Stearns for $2 per share (down from a peak of $173). This event exposed the financial system's fragility. In a panic, investors rushed to hold more cash, causing gold prices to trend downward starting in March 2008.
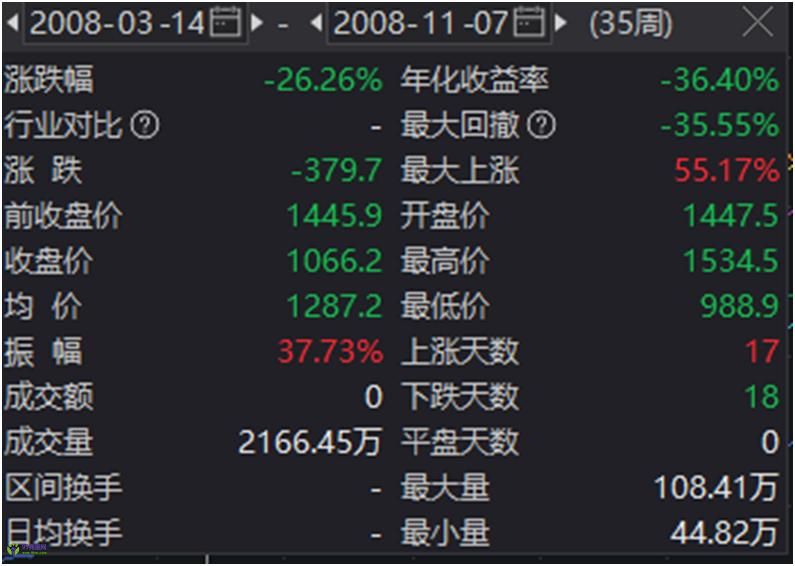
In July 2008, Fannie Mae and Freddie Mac, holding $5 trillion in mortgage-backed securities, faced collapse. The U.S. Congress authorized the Treasury to provide unlimited funding and take them into conservatorship. This further shattered investor confidence, leading to continued declines in gold prices through July and August 2008. Only after global central bank liquidity injections and U.S. fiscal stimulus measures were announced in November 2008 did gold prices bottom and begin to recover. It took a full year (until November 2009) for gold to exceed its pre-crisis high. Relevant statistics on price changes and maximum drawdown during this period are shown in Table 1.
Table 1: COMEX Gold Price Statistics (35 Weeks from March 2008 to November 2008)
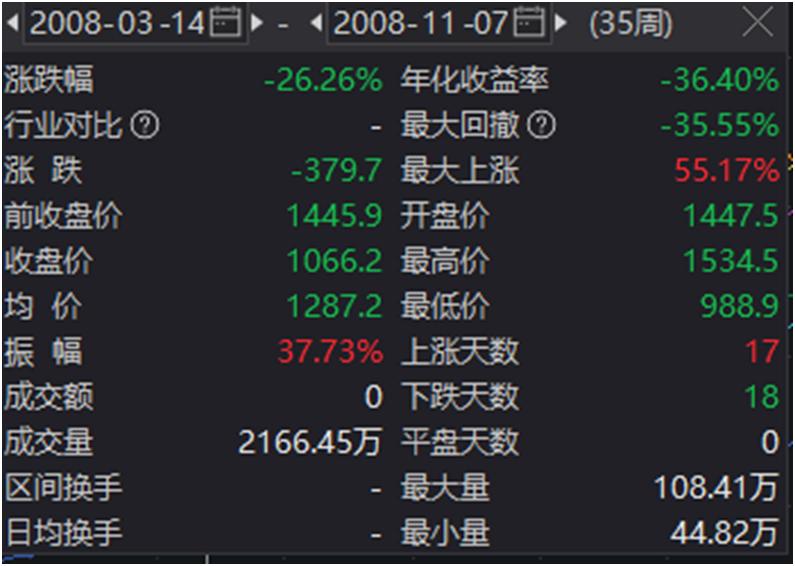
Data Source: Wind
I. Cyclical Liquidity Crises and the Distortion of Safe-Haven Assets
Cash, with its legal status for debt settlement, is indisputably a safe-haven asset. Other assets, such as money market fund shares or short-term Treasury bills, can also serve as safe havens if they can be quickly converted to cash with minimal loss.
On a micro level, an individual's investment portfolio consists of cash and risk assets. The ratio between them is influenced by monetary policy and personal risk appetite. Central banks can observe risk asset prices and use policy tools to influence overall market risk sentiment.
Because holding cash yields very low returns, investors seek other assets to substitute for cash in their portfolios—this is where "safe assets" come in. However, when exogenous shocks occur and these safe assets prove insufficient to meet the portfolio's liquidity demands, a financial crisis can erupt.
Again, the 2008 crisis serves as a case study. Financial innovation produced derivatives like Credit Default Swaps (CDS). Insurers then guaranteed these, leading to Collateralized Debt Obligations (CDOs). Investors used these complex derivatives to replace cash or high-grade bonds in their portfolios. When the U.S. housing market collapsed, these derivatives failed to absorb the shock, triggering a systemic crisis.
The current situation shares similarities with 2008 but also has key differences. First, due to the Fed's past money printing and continuously rising U.S. debt, cash yields have become unattractive as interest rates fall. Investors are again searching for cash substitutes. However, today's "safe asset" options are more diverse, including precious metals, "all-weather" strategy fund shares, and even cryptocurrencies. From a confidence perspective, incorporating gold and silver as hedges may offer stronger risk resilience than some alternatives.
Second, precious metals now trade on three major futures exchanges (Shanghai, London, New York). Monitoring trading positions and price volatility to assess their risk resilience is far easier compared to the opaque, over-the-counter market for CDS and CDOs in 2008, which lacked centralized exchanges, transparency, and robust regulation.
II. Incorporating Oil Prices into the Analysis
Returning to the sharp correction in gold and silver on January 29, 2026, three primary factors explain the move:
-
Profit-taking after a volatile rally: Following a high-volatility surge in January, sentiment shifted towards locking in gains.
-
CME margin rule changes: In mid-January, CME switched its margin calculation for gold, silver, platinum, and palladium contracts from a fixed amount to a dynamic percentage of the contract's notional value. Initial reference rates for some accounts were set at 5% for gold and 9% for silver. During a commodity rally, this adjustment increases pressure on highly leveraged speculators. On January 30, CME raised these rates to 8% for gold and 15% for silver for non-high-risk accounts, clearly aiming to accelerate de-leveraging and mitigate risk, especially potential silver delivery defaults.
-
Trump nominates "hawkish" Fed Chair candidate Kevin Warsh.
While the first two factors are short-term, the nomination of Kevin Warsh warrants closer analysis.
Based on his past statements, Warsh's advocated "rate cuts and balance sheet reduction" essentially means compressing private sector balance sheets to repair the government's balance sheet. The goal is for the U.S. government to manage its debt at low financing costs, with the trade-off being a contraction in private debt. Given that the U.S. is now the world's top oil producer, and petrodollars from Middle Eastern exports often recycle into U.S. Treasuries, higher oil prices could mean more foreign funds available to buy U.S. debt. A Trump/Republican administration might welcome this path of higher oil prices to help suppress Treasury yields and manage the debt burden. The market reaction aligns with this view: ICE Brent crude prices rose above $70 on January 29 (see Figure 2).
Figure 2: Daily ICE Brent Crude Price Chart (September 12, 2025 – January 30, 2026)
Data Source: Wind
III. Implications and Investment Strategy
The sharp correction in gold and silver does not necessarily indicate an imminent liquidity crisis. Current investment strategies can largely remain in place. By incorporating oil prices into the analysis, we see that asset markets are primarily repricing based on the new Fed Chair nomination, not overreacting to a liquidity crisis.
-
For investors trading precious metals futures, expect continued volatility. Strategies should include reducing leverage and maintaining adequate safety margins.
-
For investors holding precious metals in their portfolios, closely monitor crude oil price trends as a reference. Until the new Fed Chair is confirmed and takes office around May, oil and precious metal prices may exhibit an inverse relationship.
(Produced by Wealth Management Weekly - Finance & Markets)
Disclaimer: The views expressed in this article do not constitute investment advice. Investors acting upon this information do so at their own risk.

Permalink: http://www.chinaservicesnet.com/article/78.html(Reprint with permission)
